General Area Description
The regional areas of Mexico are represented by the areas of Yucatan Peninsula and Central Mexico. The study areas include tropical and subtropical moist broadleaf forests, dry broadleaf and coniferous forests, and mangroves. The study area in central Mexico additionally includes deserts and xeric shrublands.
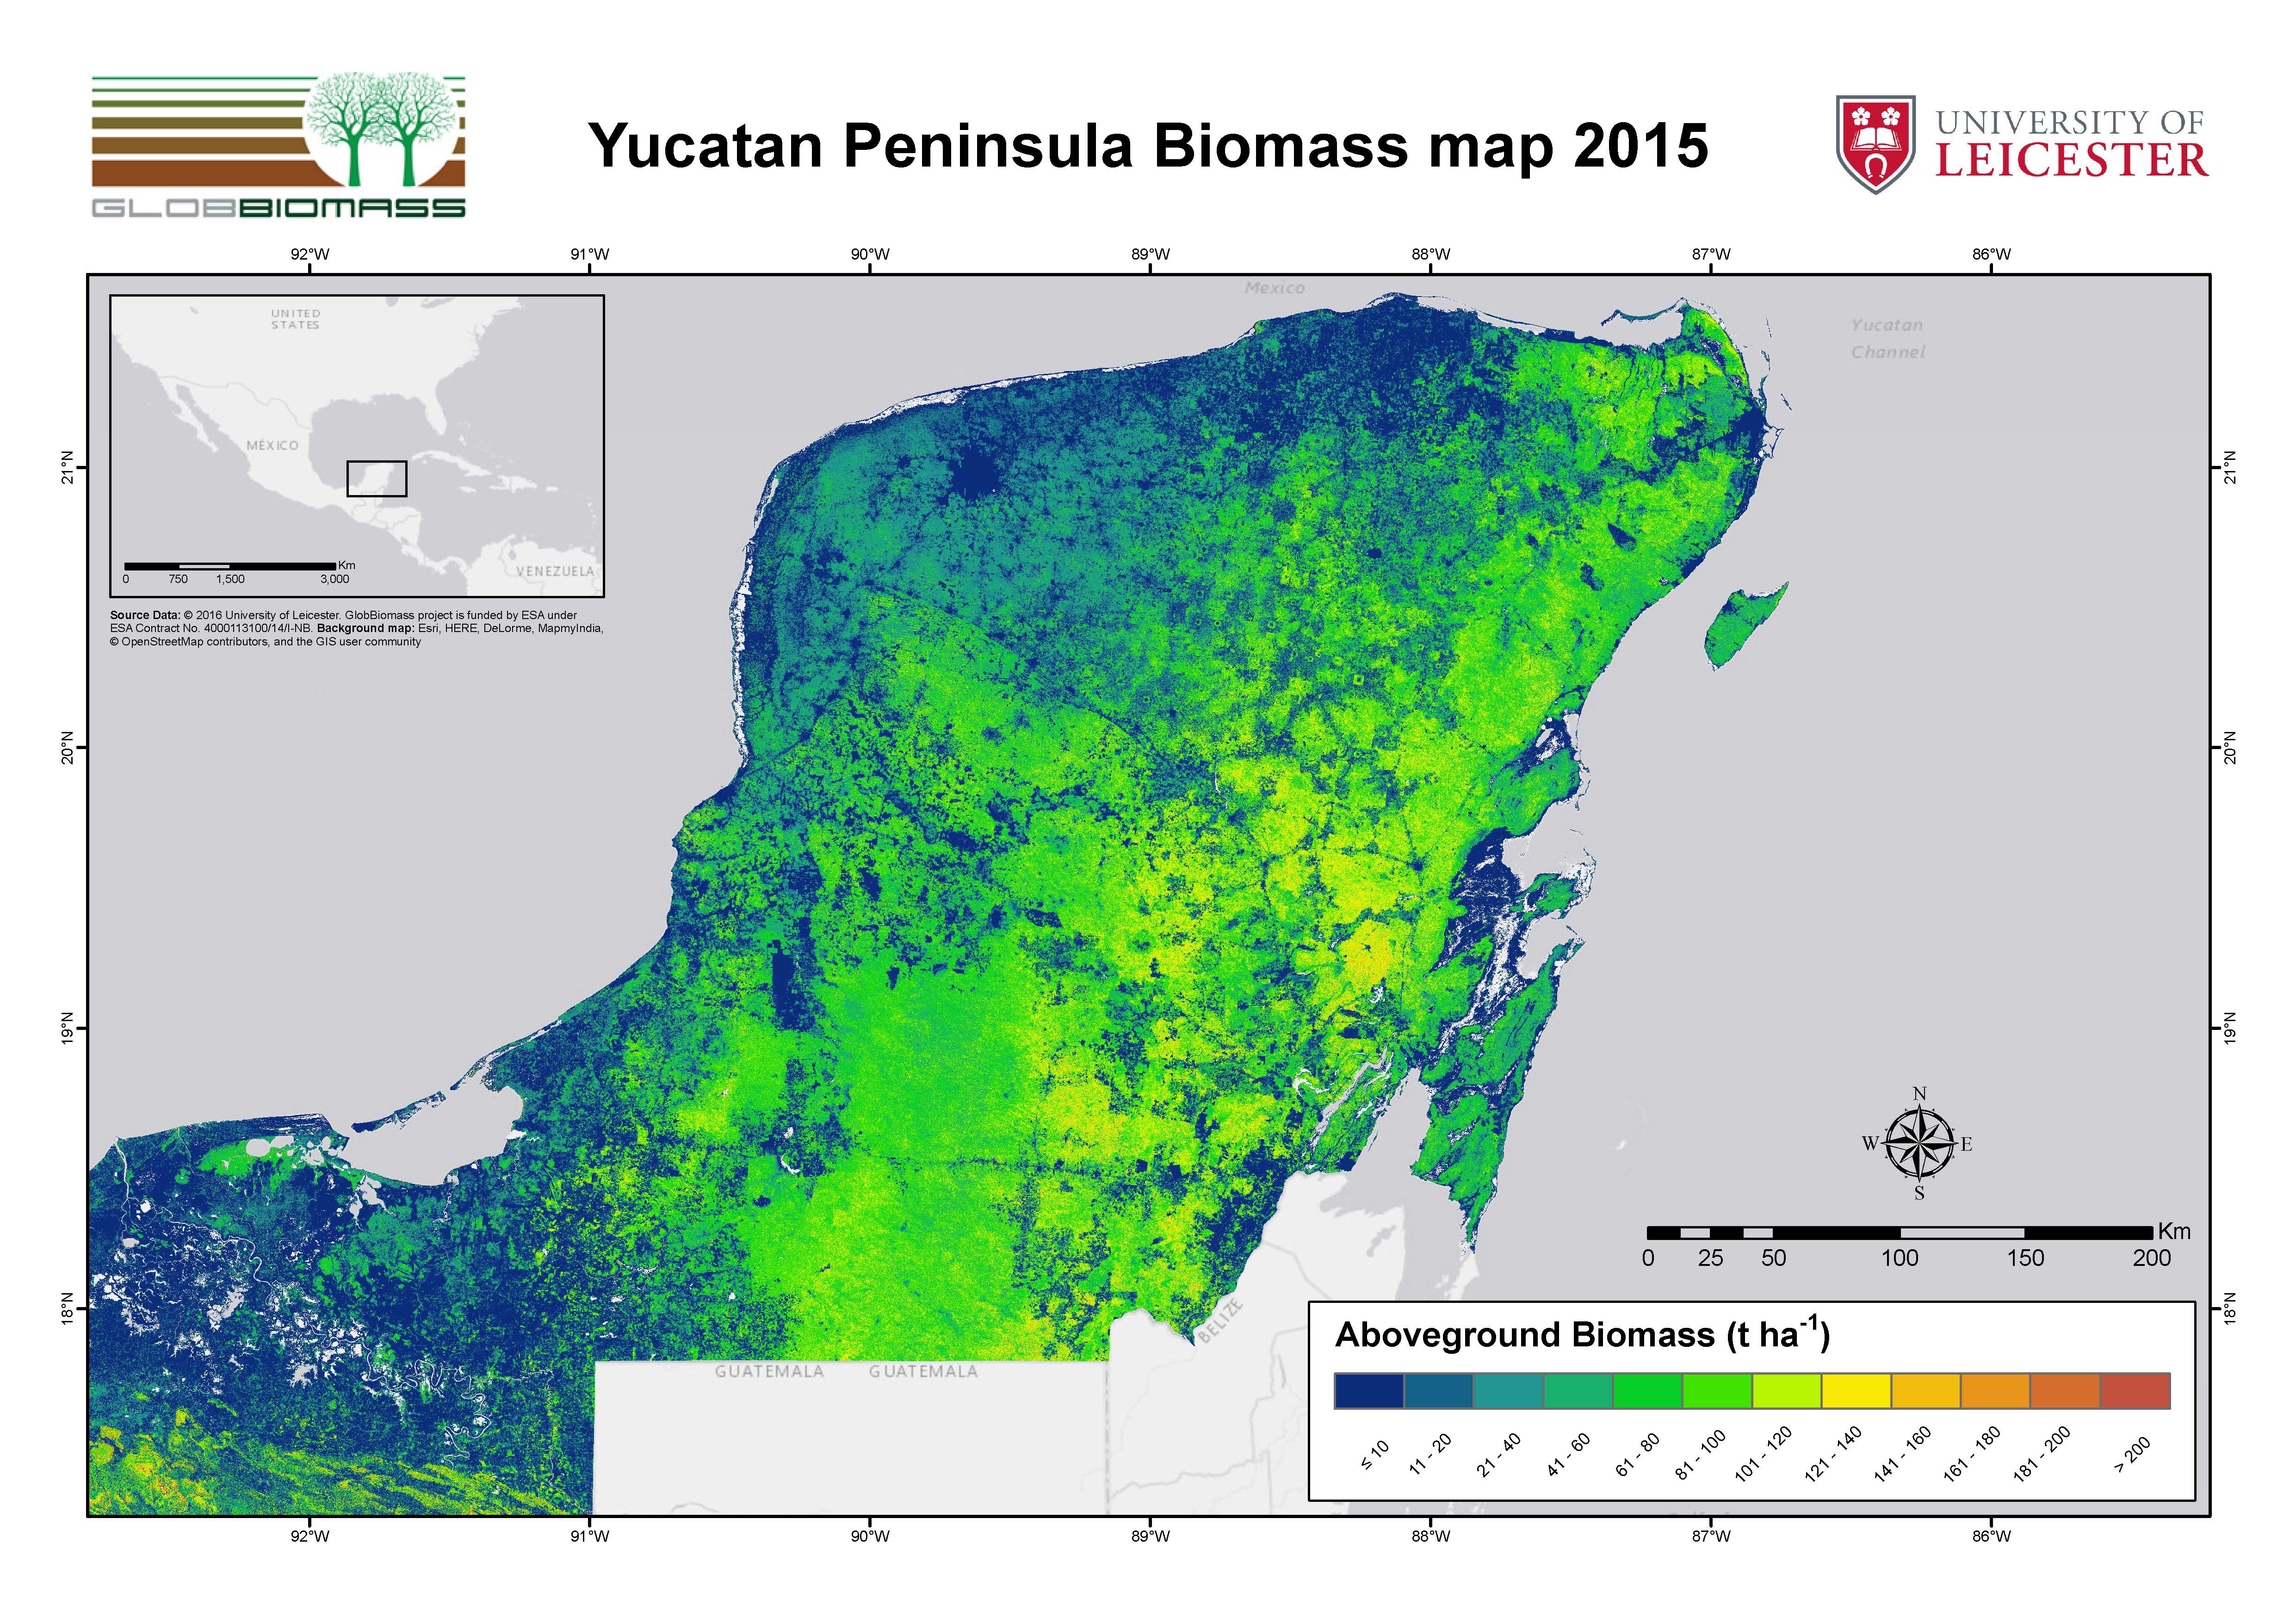
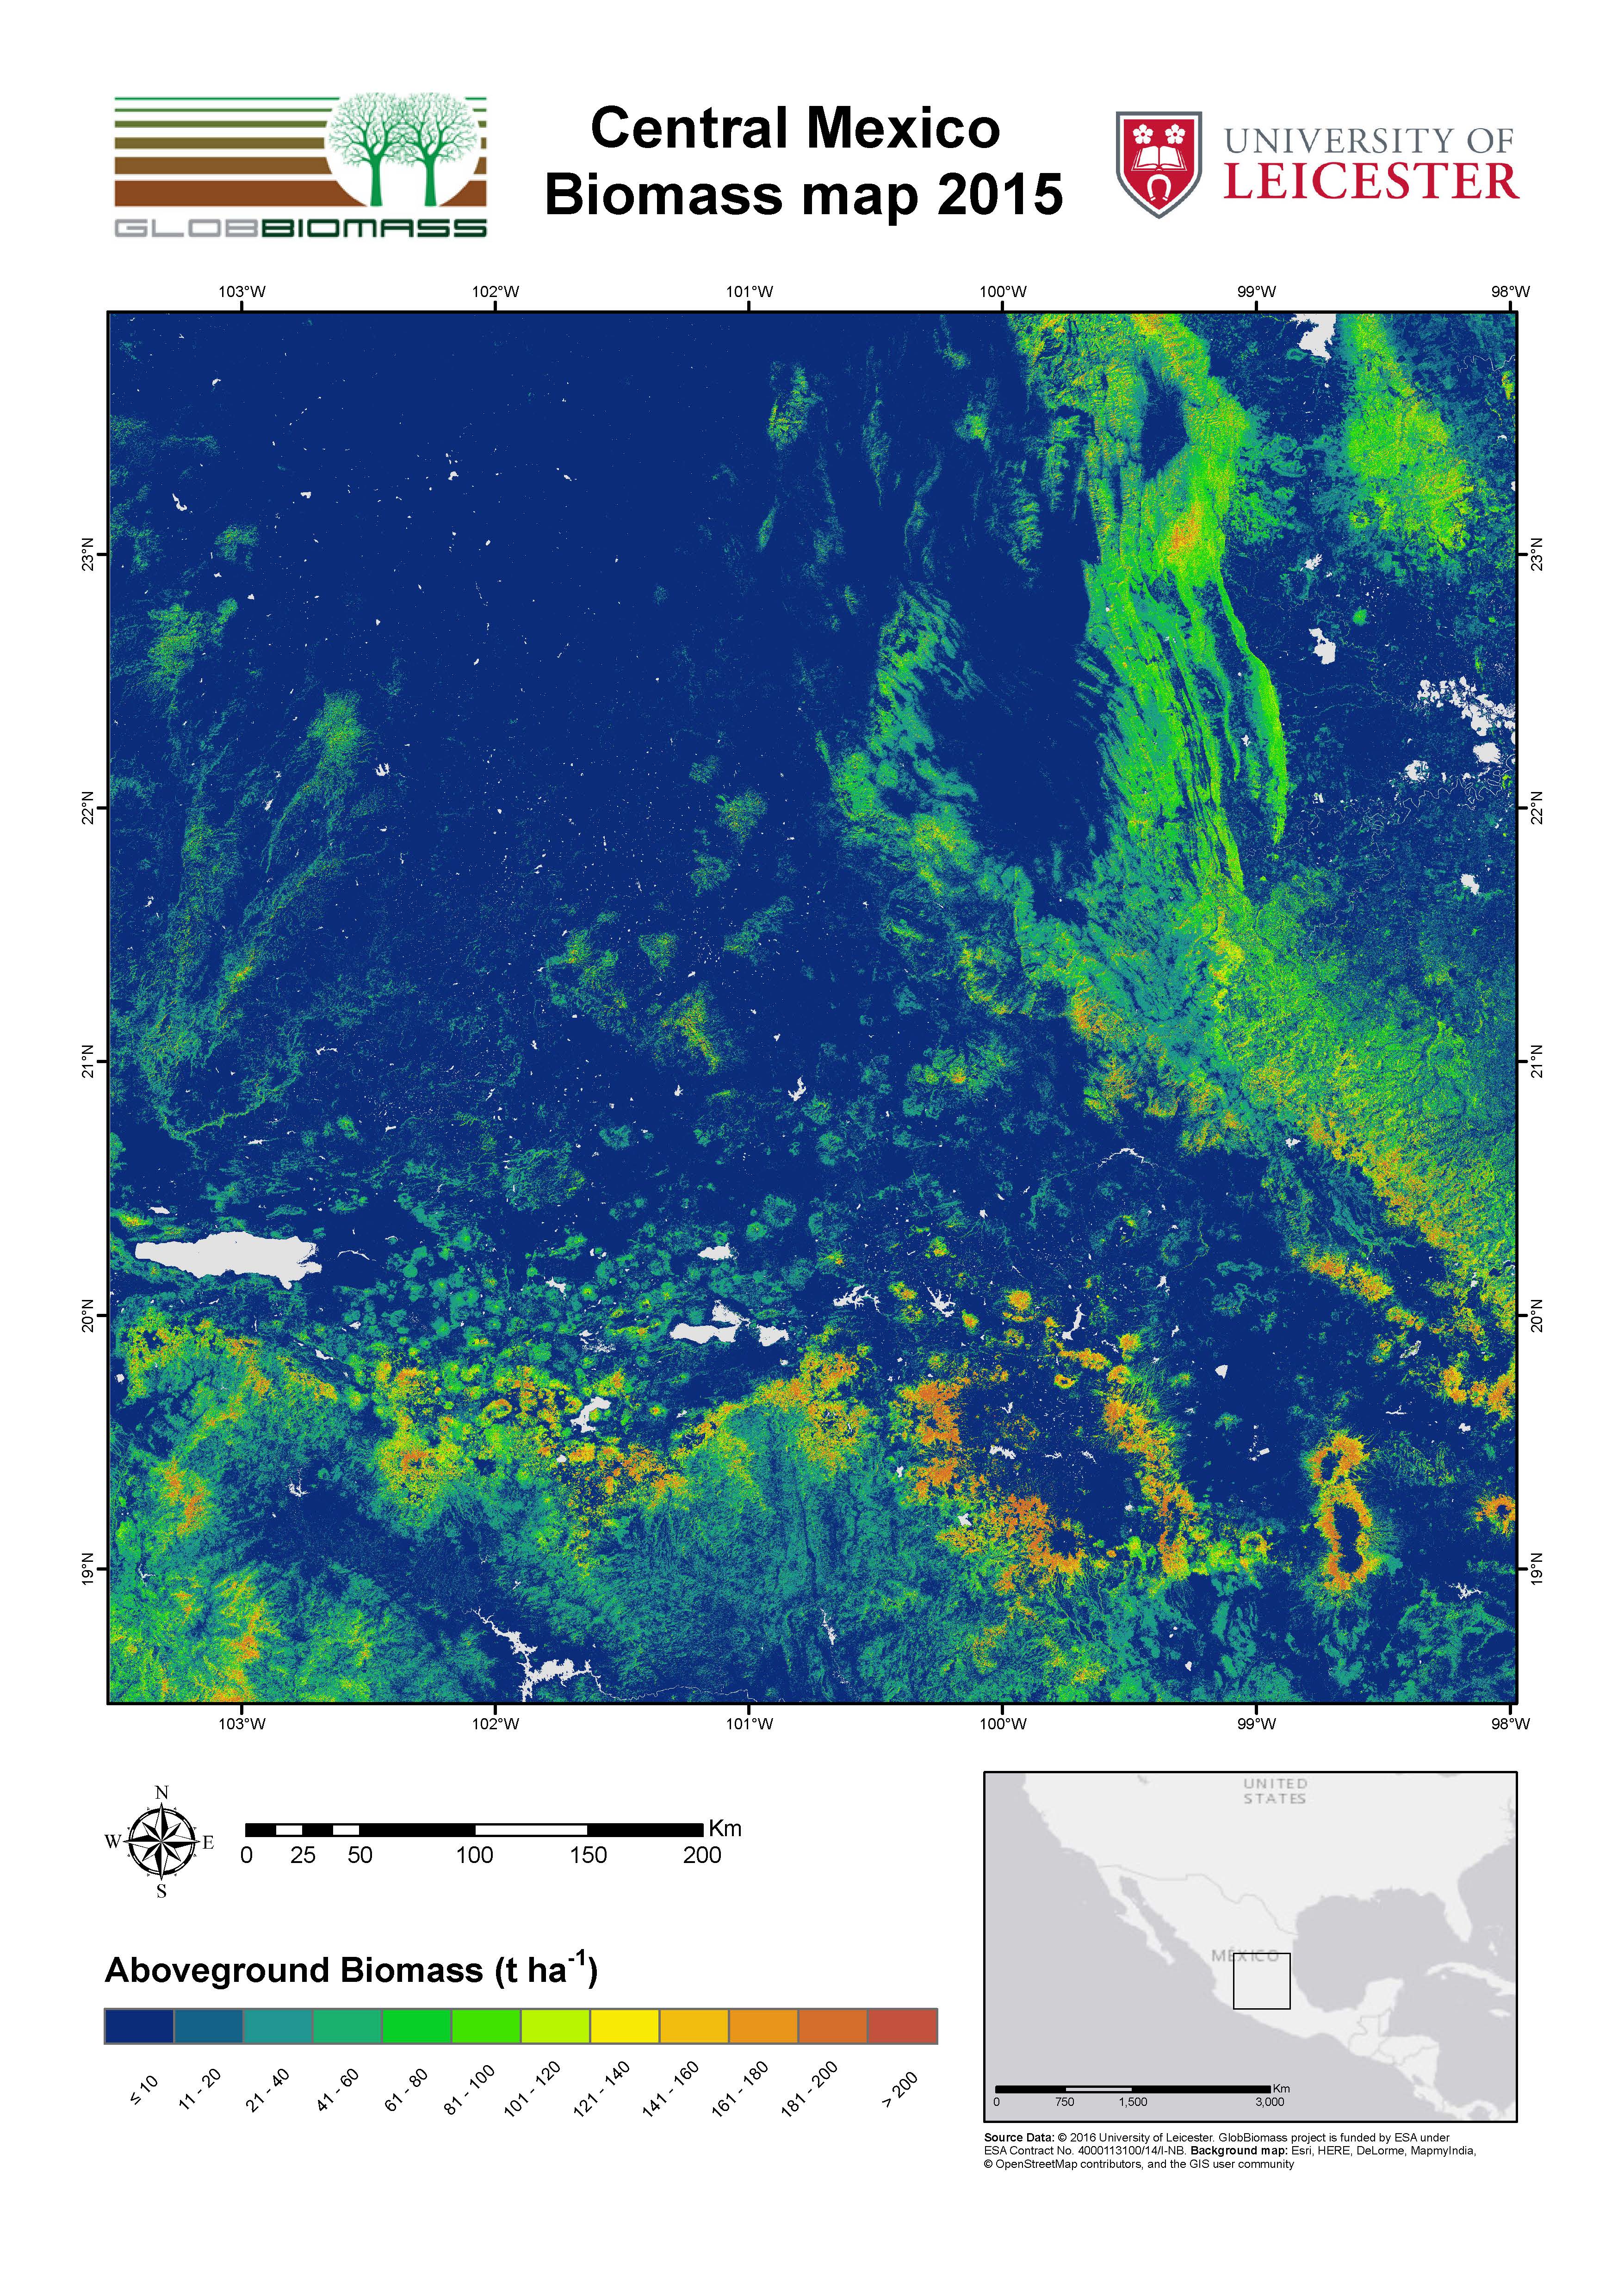
Regional Mapping Product – Reference Year 2015
| Spatial Data | ALOS-2 PALSAR-2 dual polarization (2015), Landsat 8 Surface Reflectance (2015±1), Sentinel-1 GRD dual polarization (2015/16), Landsat Percent Tree Cover (Hansen et al., 2013), SRTM (2000) |
| Additional Data | Landsat Percent Tree Cover was used to determine the modelling extent (see methods). Any land area with a Percent Tree Cover below 1% has a value of 0 by default. The Land Use and Vegetation layer (LUV) series V developed by INEGI and the JRC Global Surface Water layer were used to assign 0 value to permanent and seasonal water bodies |
| Training Data | Forest inventory dataset provided by the Comision Forestal Nacional of Mexico – CONAFOR |
| Algorithm | This map shows aboveground woody biomass in Mexican forests. The map was generated by combining the probabilistic outputs from a Maximum Entropy (MaxEnt) algorithm. Field inventory plots (CONAFOR, INFyS) were used in combination with SAR (JAXA ALOS-2 PALSAR-2 and ESA Sentinel-1) and optical data (NASA Landsat 8), as well as a digital elevation model (NASA SRTM).
Additional info: An empirical linear regression model with AGB as dependant variable (Ln-transformed) and SAR backscatter intensity (DN values) of the HV polarization as the independent variable was fitted to estimate AGB over mangrove and other wetland vegetation |
| Product Preview
|
  |
| Development |
NCEO-University of Leicester, UK |
| Information | contact@globbiomass.org |
| Download pdf-map | Yucatan Peninsula Biomass map 2015 / Central Mexico Biomass map 2015 |
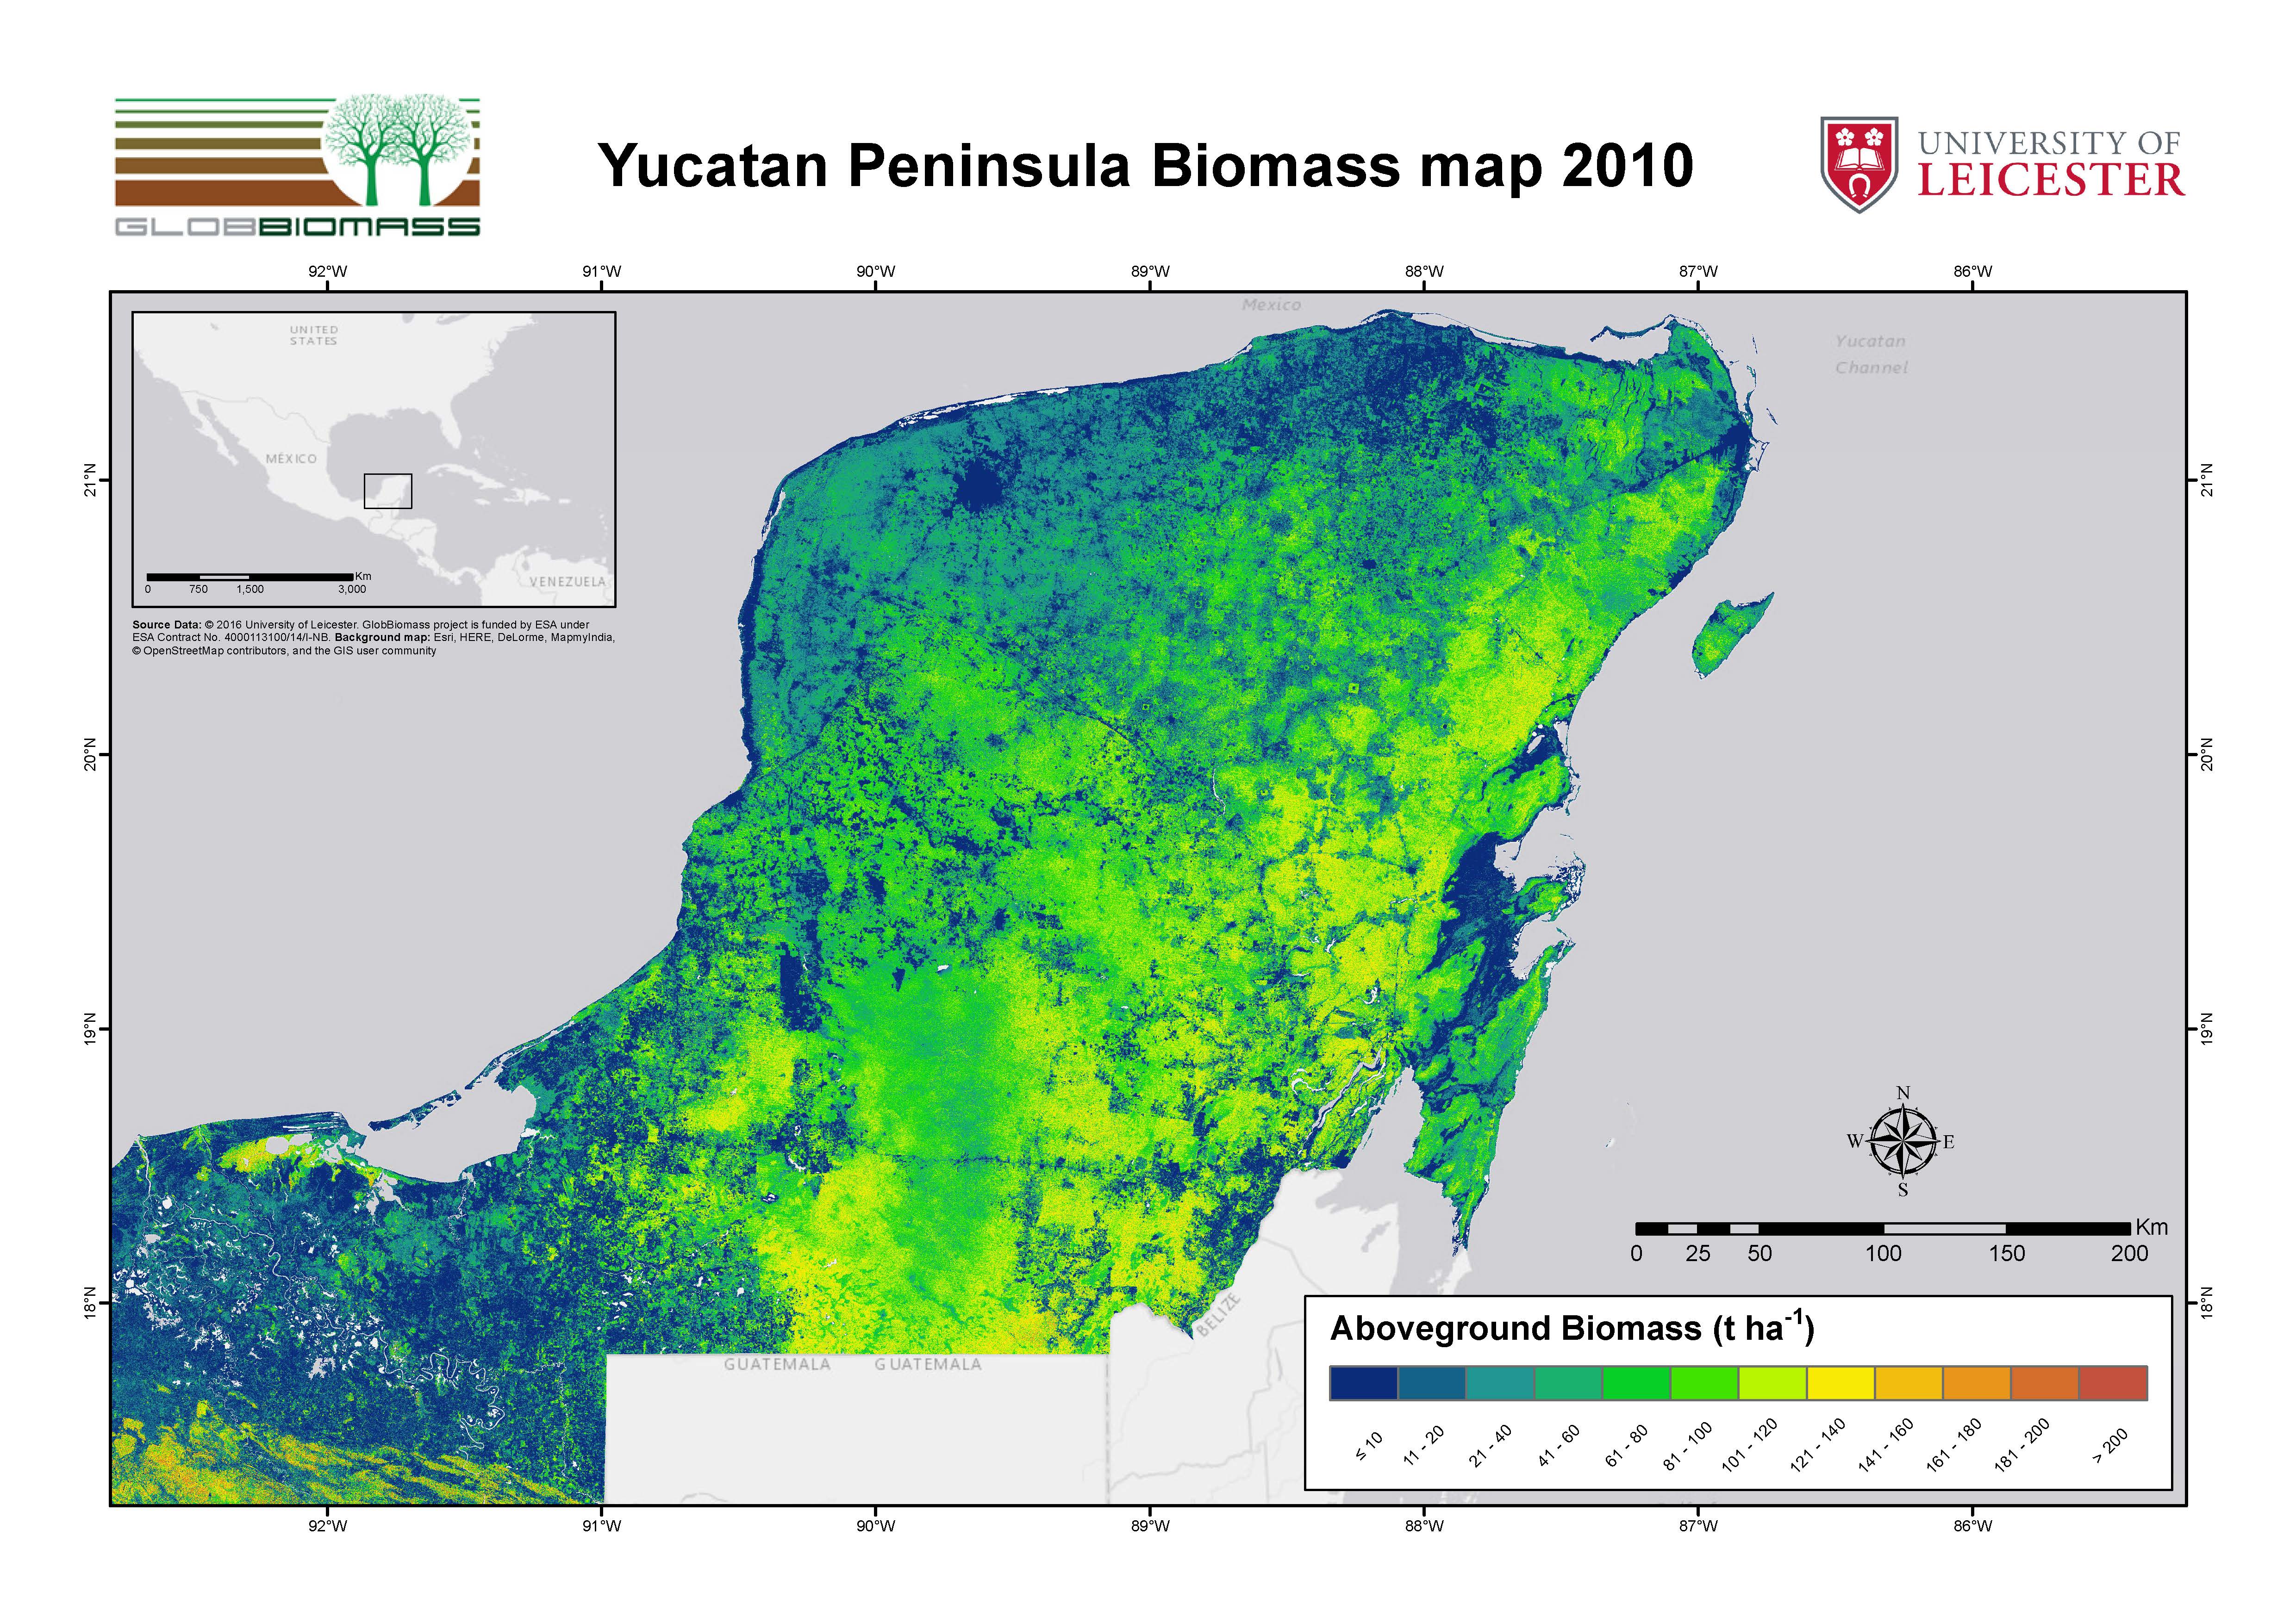
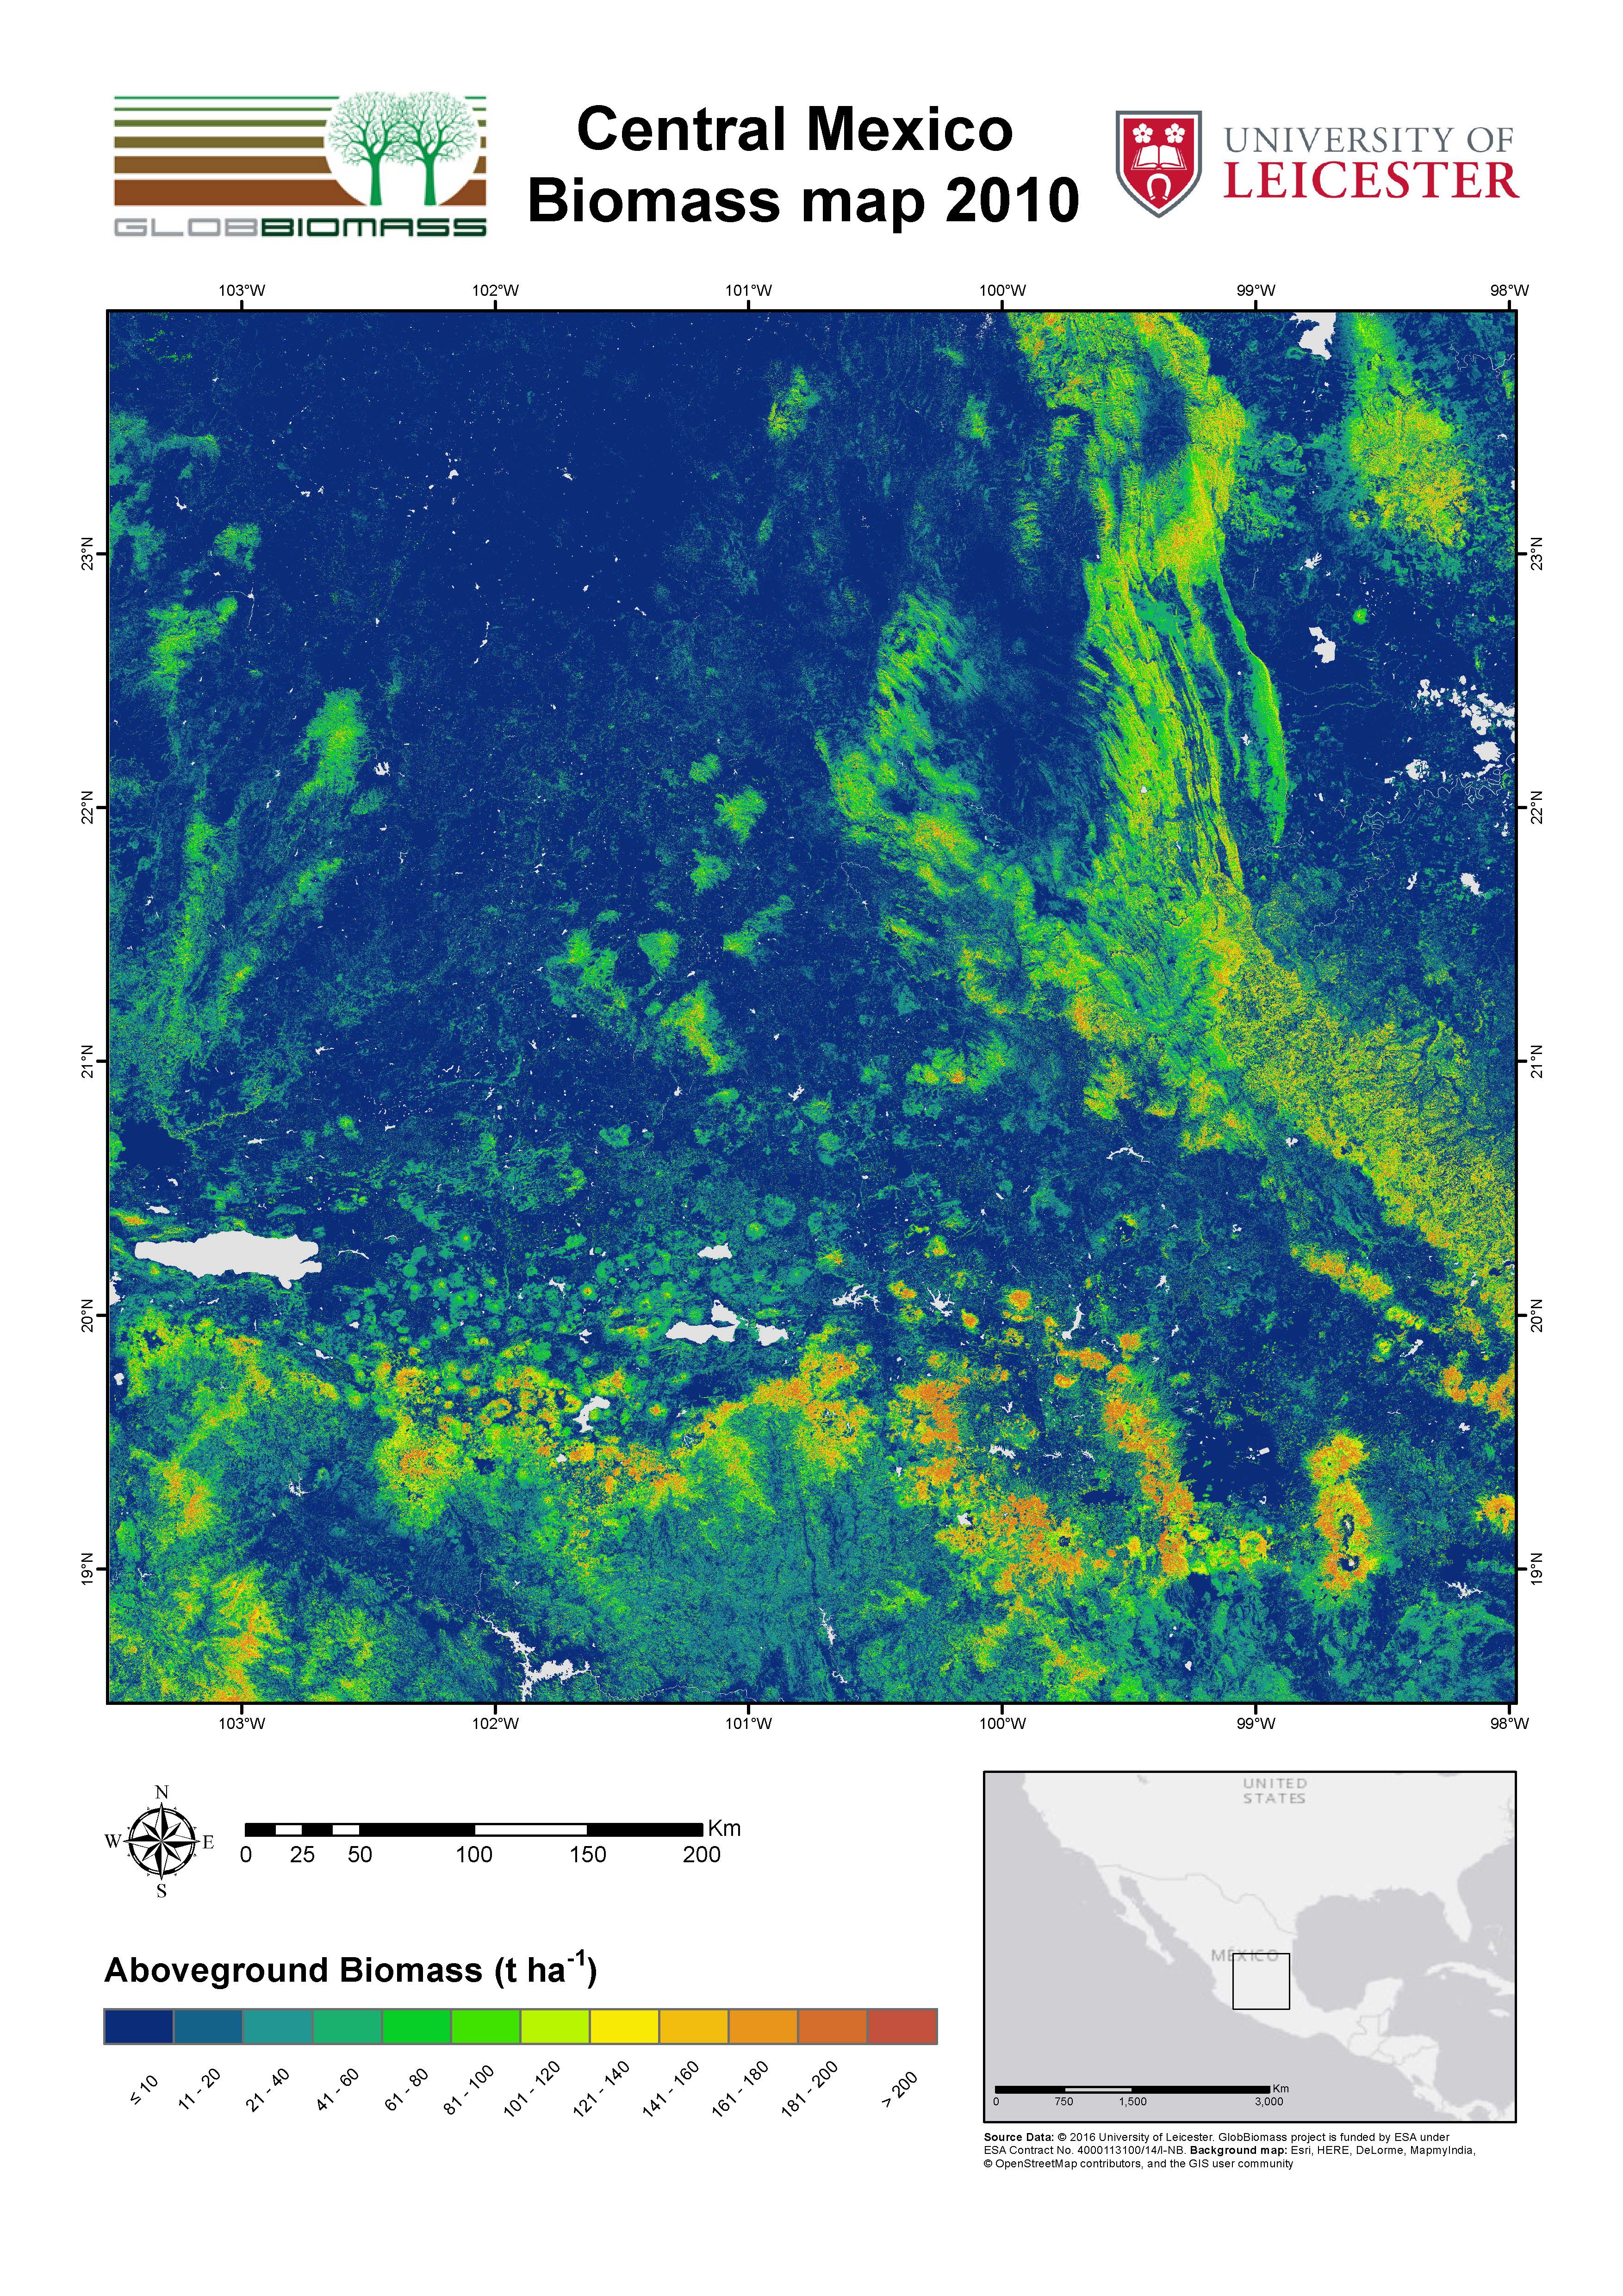
Regional Mapping Product – Reference Year 2010
| Spatial Data | ALOS PALSAR dual polarization (2009/10), Landsat 7 Surface Reflectance (2010±1), Landsat Percent Tree Cover, SRTM (2000) |
| Additional Data | A forest probability layer was used to determine the modelling extent (see methods). Any land area with a forest probability below 1% has a value of 0 by default. The Land Use and Vegetation layer (LUV) developed by INEGI was used to assign NoData value to water bodies and 0 value to urban areas |
| Training Data | Forest inventory dataset provided by the Comision Forestal Nacional of Mexico – CONAFOR |
| Algorithm | This map shows aboveground woody biomass in Mexican forests. The map was generated by combining the probabilistic outputs from a Maximum Entropy (MaxEnt) algorithm. Field inventory plots (CONAFOR, INFyS) were used in combination with SAR (JAXA, ALOS PALSAR) and optical data (NASA, Landsat 7 ETM+), as well as a digital elevation model (NASA, SRTM). |
| Product Preview
|
  |
| Development |
NCEO-University of Leicester, UK |
| Information | contact@globbiomass.org |
| Download pdf-map | Yucatan Peninsula Biomass map 2010 / Central Mexico Biomass map 2010 |
Regional Mapping Product – Reference Year 2005
| Spatial Data | ALOS PALSAR dual polarization (2007), Landsat 7 Surface Reflectance (2005±1), Landsat Percent Tree Cover, SRTM (2000) |
| Additional Data | A forest probability layer was used to determine the modelling extent (see methods). Any land area with a forest probability below 1% has a value of 0 by default. The Land Use and Vegetation layer (LUV) developed by INEGI was used to assign NoData value to water bodies and 0 value to urban areas |
| Training Data | Forest inventory dataset provided by the Comision Forestal Nacional of Mexico – CONAFOR |
| Algorithm | This map shows aboveground woody biomass in Mexican forests. The map was generated by combining the probabilistic outputs from a Maximum Entropy (MaxEnt) algorithm. Field inventory plots (CONAFOR, INFyS) were used in combination with SAR (JAXA, ALOS PALSAR) and optical data (NASA, Landsat 7 ETM+), as well as a digital elevation model (NASA, SRTM). |
| Product Preview | 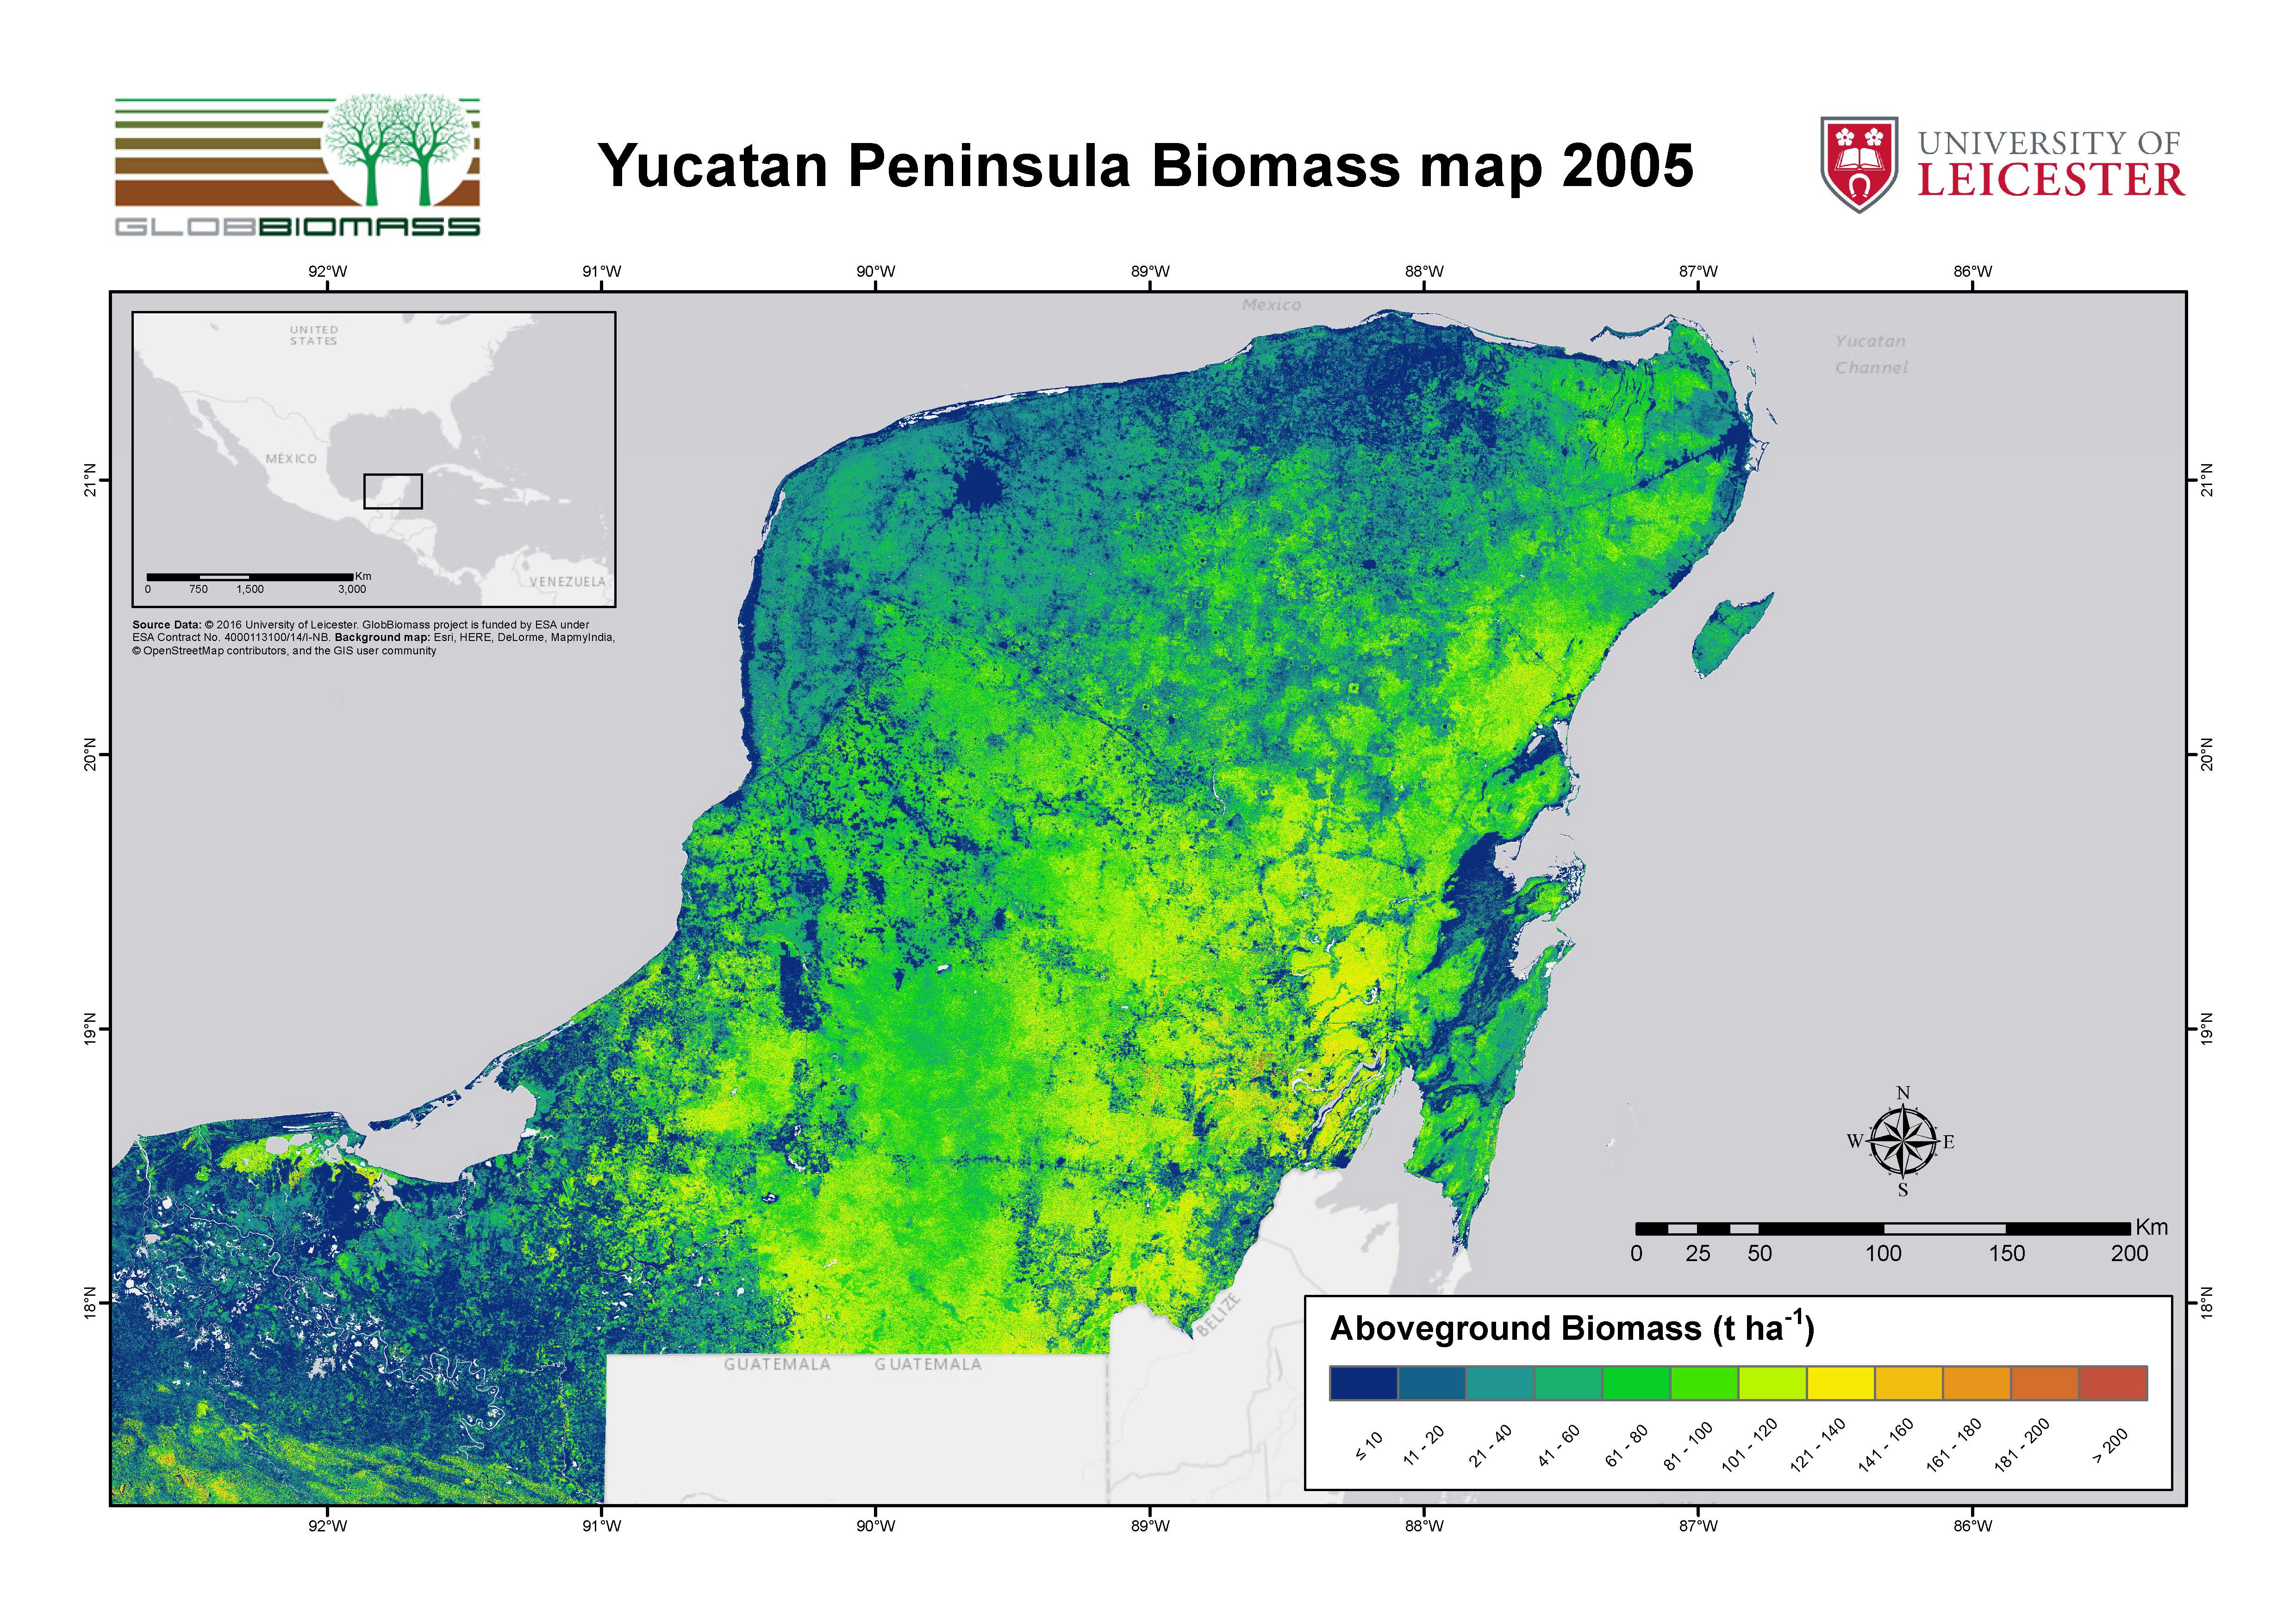 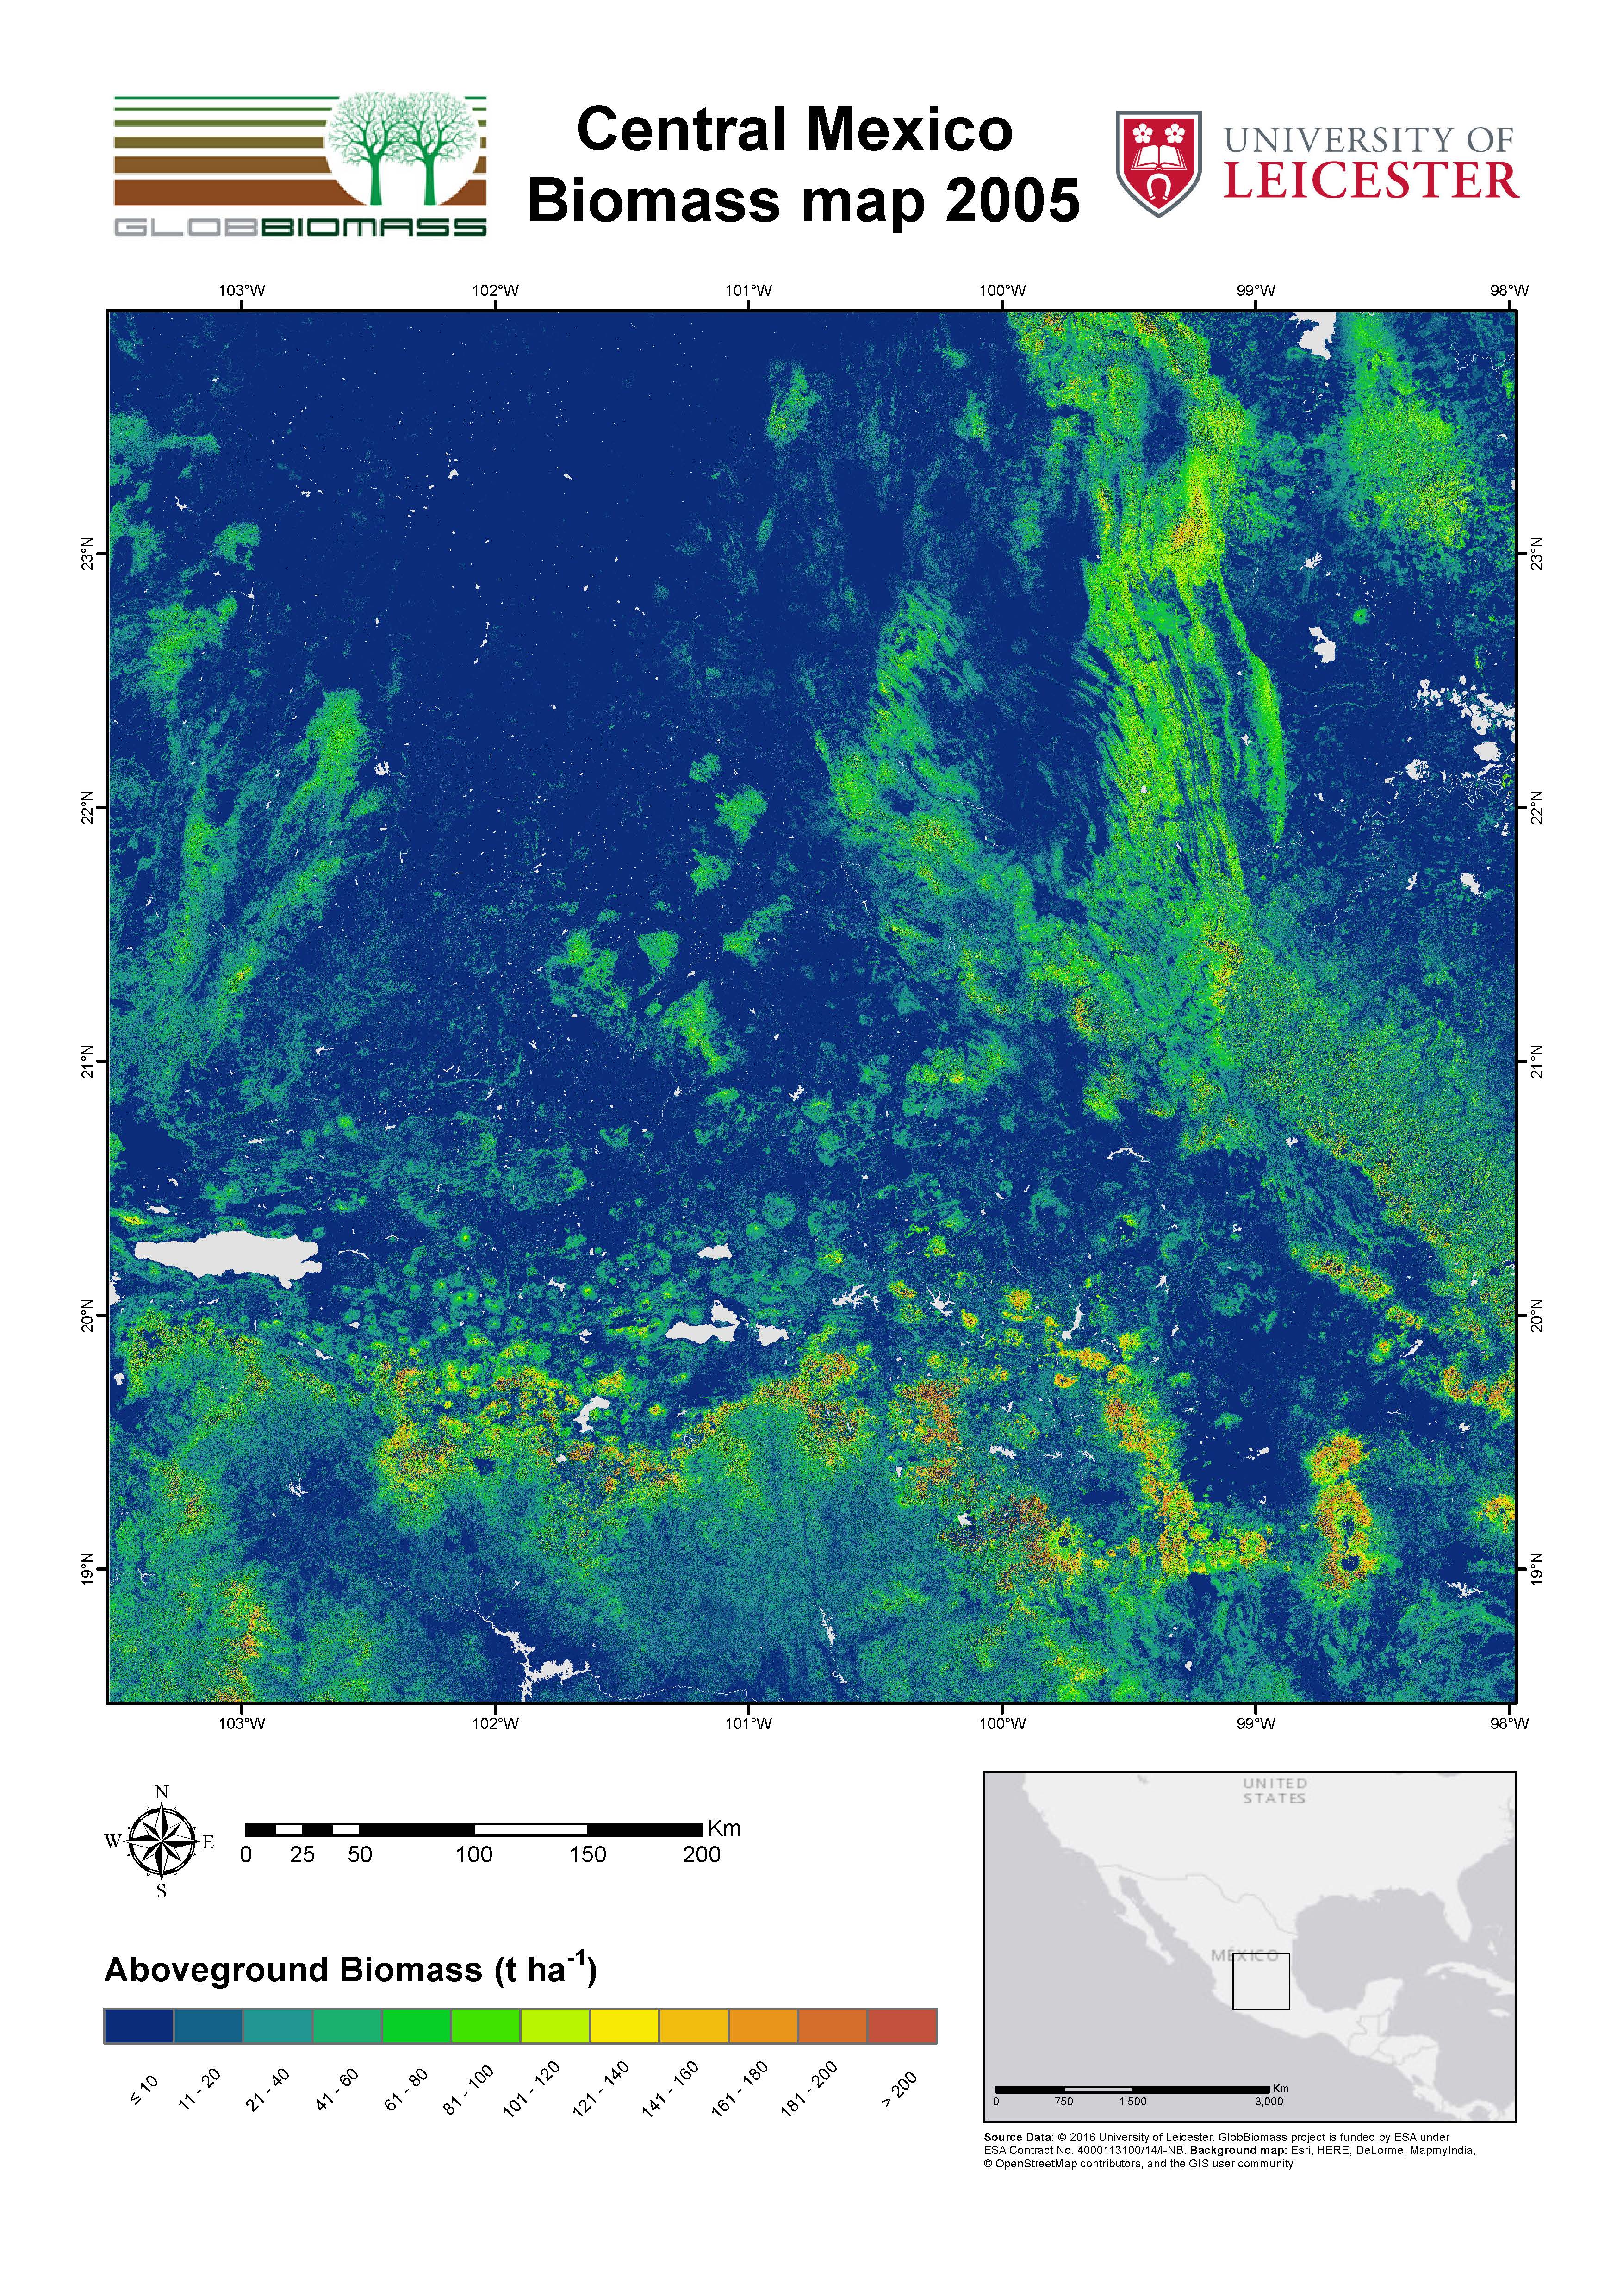 |
| Development |
NCEO-University of Leicester, UK |
| Information | contact@globbiomass.org |
| Download pdf-map | Yucatan Peninsula Biomass map 2005 / Central Mexico Biomass map 2005 |